Analytics
In Visual Scripting, the analytics currently available are mainly to provide more information about your Game Offers and how they are performing. There are two kinds of analytics shown: User Counts and Game Offer Revenue from Purchases.
User Counts
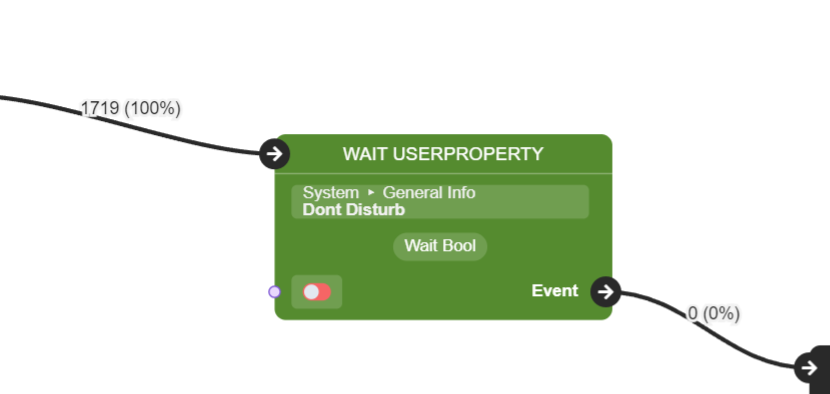
The User Counts analytics can be seen on top of the links between Flow Ports. These counts show how many end users have gone through which nodes and taken which paths through your Scripts. The percentage next to the user count on a path is the percentage of end users that got through this path compared to the end users that entered this Script. These can be helpful when determining how many end users have purchased or declined an Offer.
Warning: Currently, if you have any link loops in your Script, the user count on the paths in these loops may exceed the number of end users entering the Script, causing them to have percentages greater than 100%. This is a known issue; we'll update this warning once this issue has been fixed.
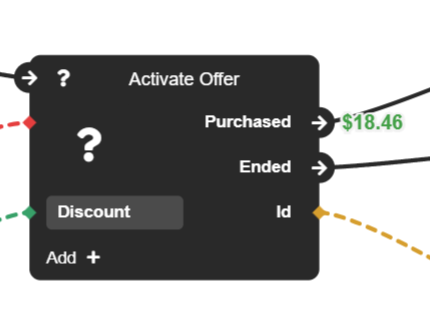
Game Offer Revenue from Purchases
The Revenue from Purchases are only available and tracked for Activate Offer nodes. This analytics can be found next to the node's Purchased exit port. Once your Game Offers are being purchased and getting some revenue, the revenue will be shown here in USD.